- completion-model institutions
- 1,618
- institutions in the broader comparison
- +520
- PCA variance in the first two components
- 70.3%
The question
How do cost, financial aid, selectivity, enrollment, and institution type relate to college completion and earnings?
Data and sample
The audited source snapshot contains 6,273 institution records. Suppressed and non-numeric entries were treated as missing. Complete-case counts vary: 1,618 for the completion model, 2,138 for the model excluding admission rate, 1,949 for earnings, and 1,727 for PCA. The saved SQL missingness output reports admission rate missing for 69.55% of the source.
My contribution
Prepared institution-level College Scorecard data, assessed missingness, estimated completion and earnings regressions, compared samples with and without admission rate, applied 10-fold cross-validated Lasso, and performed standardized PCA. Extended the project with a Python-to-SQLite audit and an Excel report for sample-count checks, institution-type summaries, and missingness review.
Findings and evidence
Cost of attendance was positively associated with completion and earnings; Pell Grant participation was negatively associated with both, conditional on the other included predictors. Completion R² was 0.4834 and earnings R² was 0.5053. These describe in-sample fit, not held-out prediction.
- With admission rate
- 1,618 complete cases · adjusted R² 0.4815
- Without admission rate
- 2,138 complete cases · adjusted R² 0.4082
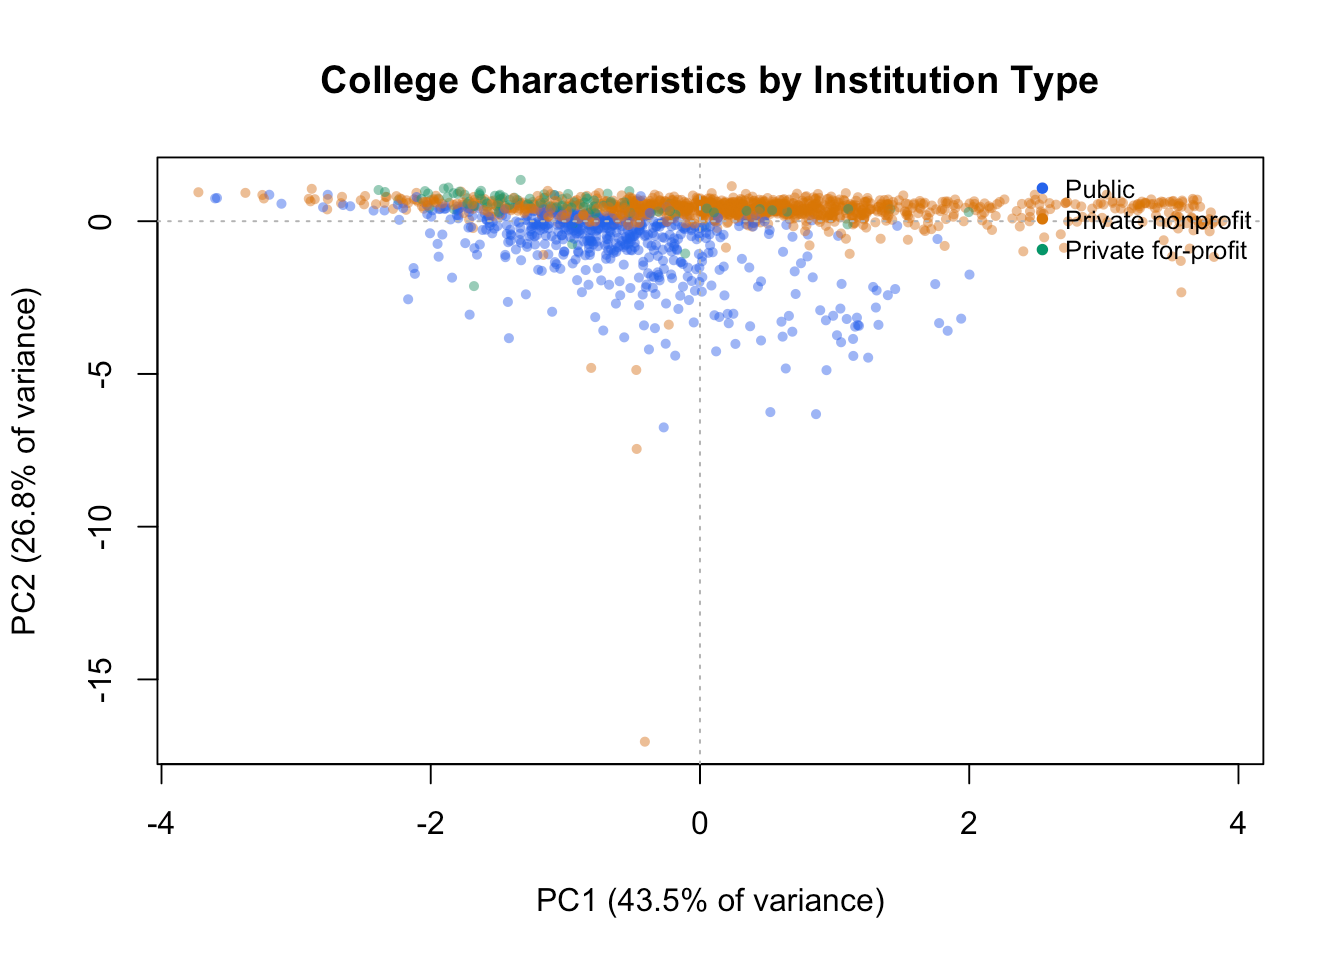
Adjusted completion R² was 0.4815 with admission rate and 0.4082 without it. Lasso retained all predictor terms at the minimum-error penalty. In PCA, PC1 contrasted cost with admission rates and Pell participation; PC2 was dominated by enrollment. Institution types overlap in the plot.
 Open full size ↗
| Model | Complete cases | R² | Adjusted R² |
|---|---|---|---|
| Completion | 1,618 | 0.4834 | 0.4815 |
| Completion without admission rate | 2,138 | Not listed | 0.4082 |
| Earnings | 1,949 | 0.5053 | Not listed |
SQL validation & sample checks
The extension audits 14 selected fields from 6,273 College Scorecard records. Python normalizes suppressed and non-numeric values, loads an in-memory SQLite database, and exports identifiers, sample-membership flags, missingness, and institution-type summaries.
| Analysis sample | SQLite count | Reported R count |
|---|---|---|
| Completion with admission | 1,618 | 1,618 |
| Completion without admission | 2,138 | 2,138 |
| Earnings | 1,949 | 1,949 |
| PCA | 1,727 | 1,727 |
The saved audit has 6,273 unique, non-missing UNITIDs. All four SQL counts agree with the reported R counts. The project log also records exact R-to-SQL UNITID-set matches for all four samples, with zero IDs unique to either source.
Repeatable checks
The audit derives QA totals from the data rather than hard-coding them. Two synthetic-data tests cover numeric conversion and basic sample selection. A separate comparison script validates identifiers and inclusion flags, writes a reconciliation CSV, and returns a failure if any R and SQL sample differs.
Excel reporting
I used Python and openpyxl to generate a workbook from the SQL audit exports. The committed file contains four worksheets and eight comparison formulas.
| Worksheet | Purpose |
|---|---|
| Validation | Four count differences and four IF-based MATCH/REVIEW checks, plus identifier QA totals. |
| Definitions | Variable definitions, missing-value rules, and fields required by each sample. |
| Summary | Institution-type counts, available-observation counts, and outcome means. |
| Missingness | Missing counts and percentages for the selected numeric fields and institution type. |
To refresh the report, rerun the SQL audit and regenerate the workbook.
Interpretation and next steps
These are institution-level associations, not causal effects or estimates for individual students. Missing data limit generalization, and R² values describe in-sample fit. Next, I plan to compare a Random Forest model on a common sample.
The source repository remains private; selected methods and aggregate results are summarized here.
Analysis workflow
View the three steps
- Analyze in R Clean selected fields and examine completion and earnings with regression, Lasso, and PCA.
- Audit in SQL Use Python to load selected fields into SQLite, check identifiers, and export sample-membership flags and summaries.
- Report in Excel Use Python and openpyxl to generate a four-sheet report with comparison formulas, QA totals, and summaries.
Why this work matters
Define inclusion rules, check identifiers and missing values, and make comparisons traceable before interpreting results. The Python-to-SQLite audit and Excel report show how to turn source data into repeatable QA checks and readable summaries—tasks relevant to business, pricing, and operations analytics.